In order to develop novel and innovative methods for detection and treatment of early stage diabetic retinopathy,
we are answering the following questions:
Do neuronal or vascular defects underlie early stage diabetic retinopathy?
Diabetic retinopathy is currently diagnosed in the clinic with retinal vessel changes, such as vascular leakage, edema and neovascularization. The current recommendation for diabetic patients is to have a yearly fundus exam to detect these vascular changes. However, there is a growing body of research showing that retinal neurons exhibit dysfunction prior to vascular changes. We are studying the chronology of neuronal, vascular, and neuro-vascular defects in rodent models of diabetes using various functional and imaging techniques. Figure 1 shows the order of appearance of visual and retinal function deficits in a rat model of Type I diabetes. We are currently determining which functional measures occur first and the underlying pathology that causes them in order to develop targeted treatments.

Figure 1: Chronological summary of the functional deficits found in our study. The onsets of clinically significant vascular lesions listed were estimates based on published reports on an STZ-induced diabetic rat model. Aung et al., 2013
What screening tools are most sensitive for detection of early stage diabetic retinopathy?
Our lab evaluates different visual tests as potential screening tools for early visual dysfunction in diabetic patients. We are currently focused on testing novel flash stimuli with a non-invasive electrophysiological test called the electroretinogram or ERG. The ERG is a recording of the full field potential of the retina in response to a flash of light (Figure 2).

Figure 2: Electrical potential of the retina in response to flash of light recorded with an electrode on the cornea. This composite waveform represents the activity of different retinal cell types: a: the response from photoreceptors, b: the response from the ON bipolar cells, OP: oscillatory potentials generated by the inner retina, likely amacrine cells
Using flash stimuli with different luminance levels and/or frequencies, the ERG provides information about the health of retinal pathways (rod, cone) and retinal cell types (photoreceptors, bipolar cells, amacrine cells). Using rodent models of diabetes, we have demonstrated that dim flash stimuli reveals rod photoreceptor pathway defects in early stage diabetic retinopathy (Figure 3).
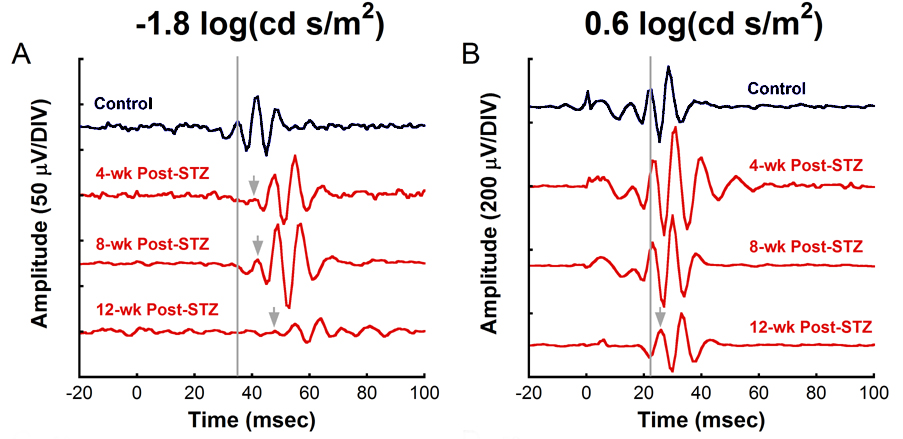
Figure 3: Electrical activity from the inner retina showing delays (grey arrows) with increasing durations of hyperglycemia from STZ in response to a dim flash (left panel) that only stimulates the rod pathways, while bright light (right panel) that stimulated both rod and cone pathways does not reveal any deficits until after 12 weeks of diabetes. Aung et al., IOVS 2013
In addition, contrast sensitivity and spatial frequency thresholds, as measured by optokinetic tracking, are decreased in early diabetic retinopathy (Figure 4). We are currently testing these methods in human subjects with diabetes to determine if they show similar defects as observed in the rodent models.
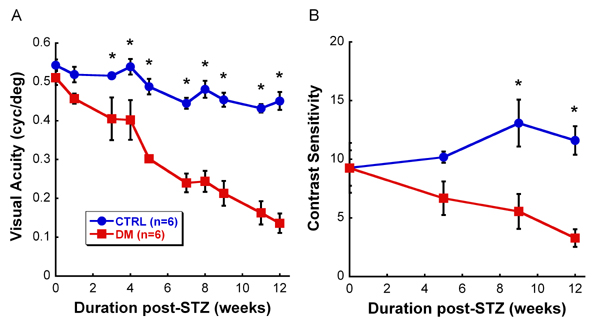
Figure 4: Visual acuity and contrast sensitivity measured with optokinetic tracking in STZ-induced diabetic rats. Visual acuity and contrast sensitivity thresholds are significantly reduced very early in the disease when vascular pathology is not present. Aung et al., IOVS 2013
Additionally, we are exploring the use of fluorescent markers to detect oxidative stress or other in vivo signs of retinal pathology. For instance, hydrocyanines are a family of dyes that fluoresce with different emission wavelengths after binding to reactive oxygen species. As shown in Figure 5, these molecules can detect oxidative stress in vivo in an induced model of photoreceptor degeneration. We continue to validate these markers in other retinal disease models to determine their potential clinical applications.
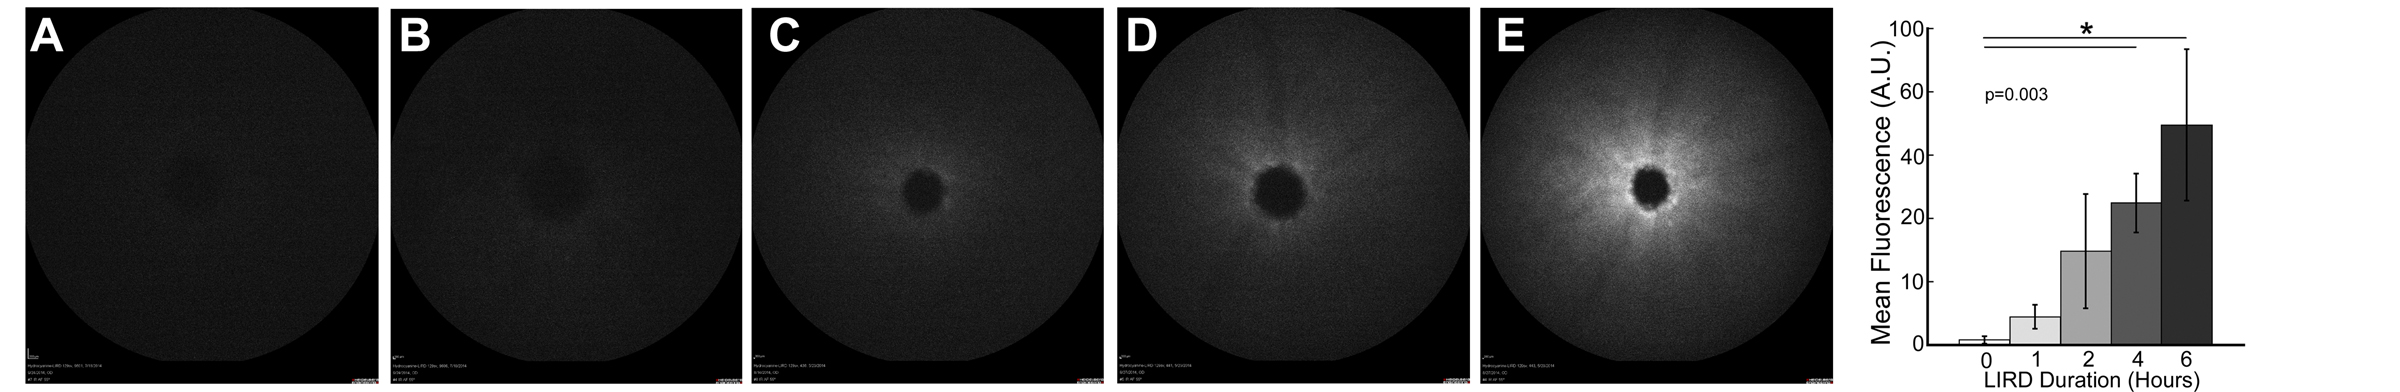
Figure 5: In vivo marker showing oxidative stress in the retina. A-E) Fundus photos of mice with increasing levels of photoreceptor degeneration show increased levels of labeling with the fluorescent marker. Far right) Quantification of fluorescence intensity at each level of retinal damage using light-induced retinal degeneration (LIRD). Adapted from Prunty et al., IOVS 2015
What neuroprotective treatments slow the rate of DR?
We are interested in developing pharmacological and rehabilitative strategies to slow the progression of vision loss. Our lab uses a number of functional, anatomical and molecular outcome measures to determine whether a particular treatment is neuroprotective. Current interests include non-invasive and pluripotent approaches like physical exercise, targeted pharmaceuticals such as L-DOPA, and anti-oxidant treatments like TUDCA. Our goal is to translate these findings to humans with ultimate use in the clinic. A small clinical trial is currently underway to test our functional screening methods for DR and the efficacy of L-DOPA.